- About MAA
- Membership
- MAA Publications
- Periodicals
- Blogs
- MAA Book Series
- MAA Press (an imprint of the AMS)
- MAA Notes
- MAA Reviews
- Mathematical Communication
- Information for Libraries
- Author Resources
- Advertise with MAA
- Meetings
- Competitions
- Programs
- Communities
- MAA Sections
- SIGMAA
- MAA Connect
- Students
- MAA Awards
- Awards Booklets
- Writing Awards
- Teaching Awards
- Service Awards
- Research Awards
- Lecture Awards
- Putnam Competition Individual and Team Winners
- D. E. Shaw Group AMC 8 Awards & Certificates
- Maryam Mirzakhani AMC 10 A Awards & Certificates
- Two Sigma AMC 10 B Awards & Certificates
- Jane Street AMC 12 A Awards & Certificates
- Akamai AMC 12 B Awards & Certificates
- High School Teachers
- News
You are here
Mathematical Treasure: Lorini's Military Fortifications
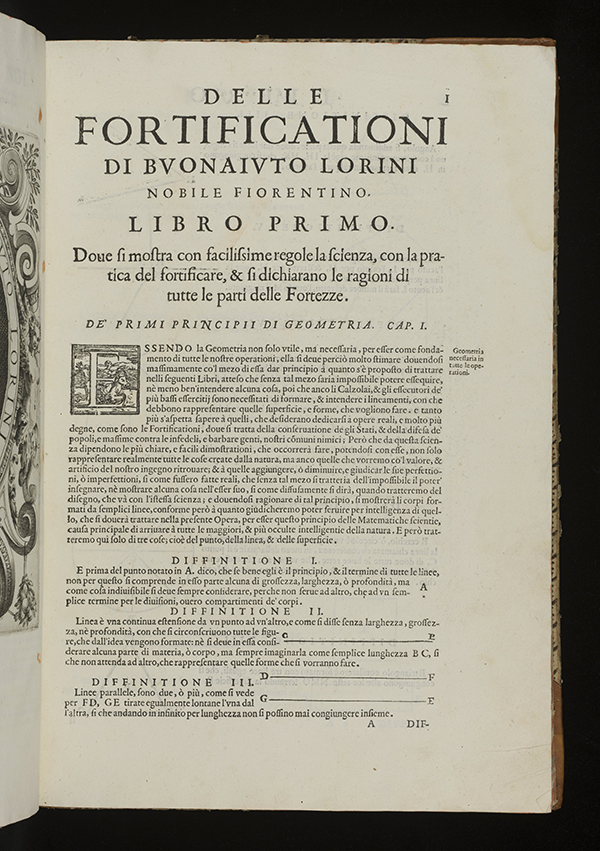
With the rise of more powerful artillery in Europe came the demand for better, stronger fortifications. Military engineers found a new area of applied geometry, the design of fortifications. Buonaiuto Lorini (ca. 1537-1611) was a Florentine nobleman and military engineer/architect. He spent much of his career in the service of the Venetian Republic. His major written work was the five-volume (later to be extended to six volumes) Delle Fortificationi (1592). This work went through several editions and translations to become a major reference on the subject of military construction. An image of the first text page for the 1597 edition is shown below.
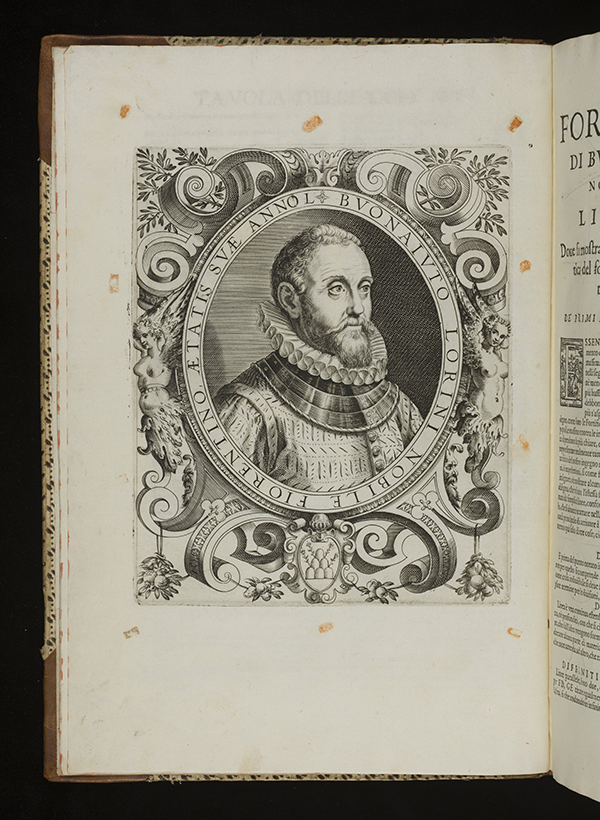
A portrait of the proud author faces the page above.
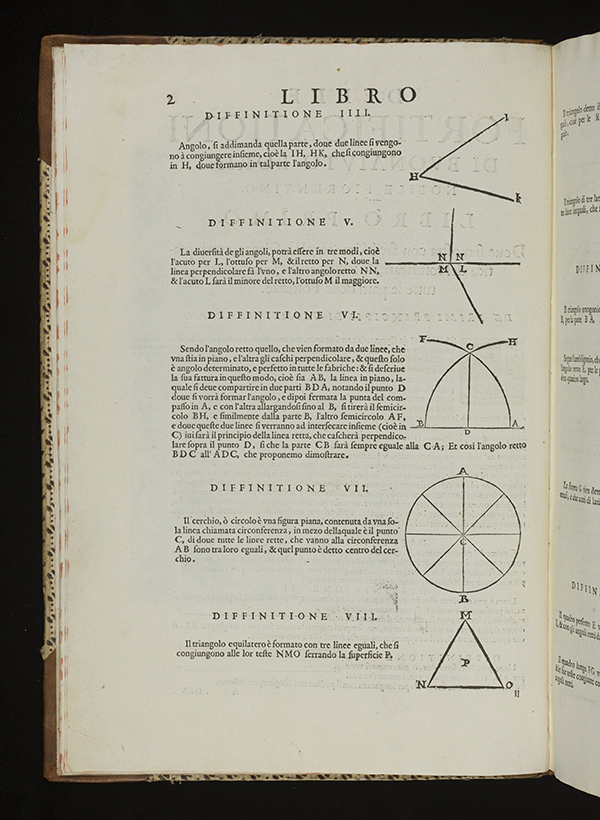
The first few pages of the book are devoted to reviewing basic geometric concepts.
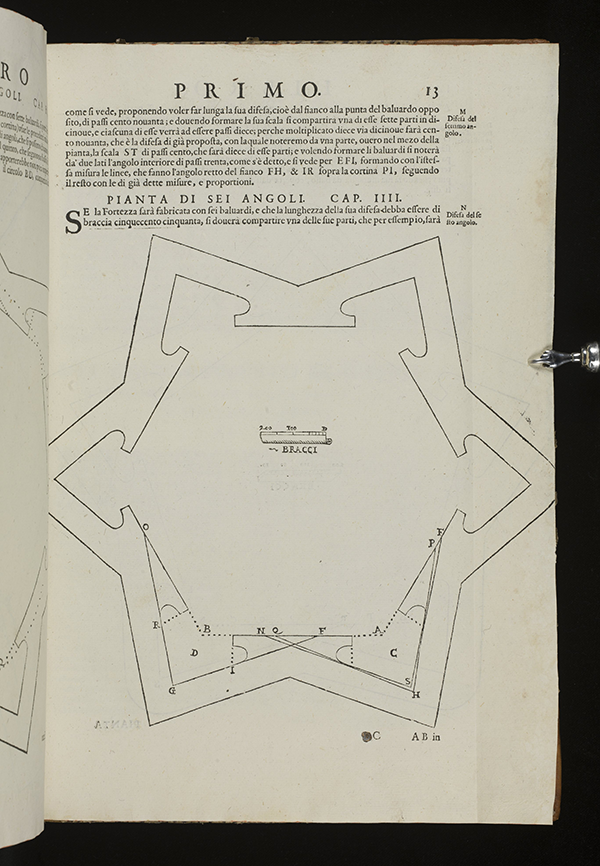
On page 13 is a diagram for a typical fort of this period. The drawing is to scale with the measurements given in bracci, plural for braccio, an Italian measure equal to the length of a man’s arm, or 66-68 cm.
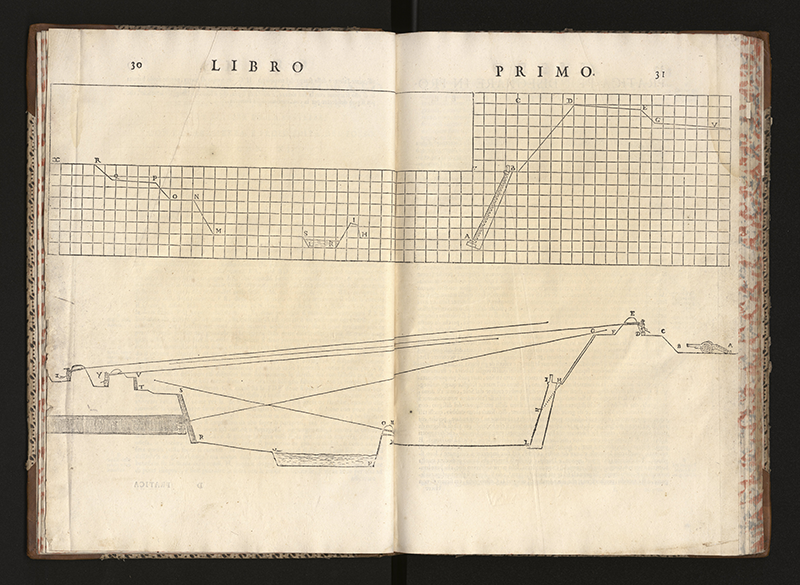
On pages 30-31, the profile of a military situation is given where an attacking, entrenched force, is moving towards and firing at a fortified structure. Note the use of a grid screen to illustrate elevation. Is this a graph? Does the “graph” represent the situation depicted below it?
The images above are presented courtesy of the History of Science Collections, University of Oklahoma Libraries.
Index to Mathematical Treasures
Frank J. Swetz (Pennsylvania State University), "Mathematical Treasure: Lorini's Military Fortifications," Convergence (May 2019)