- About MAA
- Membership
- MAA Publications
- Periodicals
- Blogs
- MAA Book Series
- MAA Press (an imprint of the AMS)
- MAA Notes
- MAA Reviews
- Mathematical Communication
- Information for Libraries
- Author Resources
- Advertise with MAA
- Meetings
- Competitions
- Programs
- Communities
- MAA Sections
- SIGMAA
- MAA Connect
- Students
- MAA Awards
- Awards Booklets
- Writing Awards
- Teaching Awards
- Service Awards
- Research Awards
- Lecture Awards
- Putnam Competition Individual and Team Winners
- D. E. Shaw Group AMC 8 Awards & Certificates
- Maryam Mirzakhani AMC 10 A Awards & Certificates
- Two Sigma AMC 10 B Awards & Certificates
- Jane Street AMC 12 A Awards & Certificates
- Akamai AMC 12 B Awards & Certificates
- High School Teachers
- News
You are here
Mathematical Treasure: Florence Nightingale’s Statistical Report on British Army Mortality
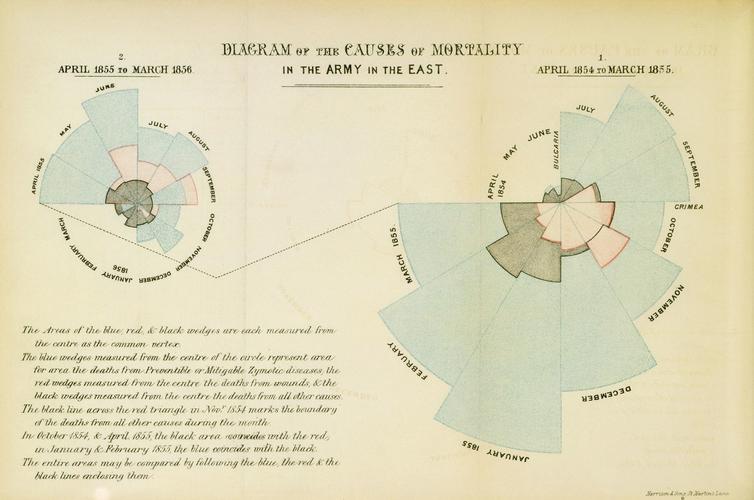
Florence Nightingale (1820–1910) was a British social reformer, pioneer nurse, and applied statistician. Her upper-class social and cultural background frowned upon women studying mathematics. However, she loved the subject, and through self-study and tutoring by the mathematician J. J. Sylvester, Nightingale became proficient in mathematics. As a nurse in the Crimean War (1854–1856), she was shocked by the existing hospital sanitary conditions, and she collected data to be organized as evidence for needed reforms. Using her knowledge of statistics, she processed the data into graphic diagrams. These diagrams were incorporated into an official army report published in 1858: Mortality of the British Army: at home and abroad, and during the Russian war, as compared with the mortality of the civil population in England; illustrated by tables and diagrams. The contents of this report illustrate the early use of statistical analysis in the health sciences.

Sample graphs from Nightingale’s portion of the report:


This full report can be obtained from the Internet Archive.
The third graph shown above was also presented to Queen Victoria by Florence Nightingale in her own report: Notes on Matters Affecting the Health, Efficiency, and Hospital Administration of the British Army, also published in 1858. This “pie-graph,” whose sectors Nightingale referred to as “coxcombs,” was her own design.

This image provided courtesy of the collections of the Royal Trust.
Florence Nightingale was the first woman admitted to the Royal Statistical Society in 1858. A letter she wrote in 1875 about her election to the American Statistical Association is also available in Convergence. Engage students with her graph and other early contributions to statistics with the classroom activity, “Seeing and Understanding Data: A Mini-Primary Source Project for Students of Statistics."
Frank J. Swetz (The Pennsylvania State University), "Mathematical Treasure: Florence Nightingale’s Statistical Report on British Army Mortality," Convergence (February 2023)


