- About MAA
- Membership
- MAA Publications
- Periodicals
- Blogs
- MAA Book Series
- MAA Press (an imprint of the AMS)
- MAA Notes
- MAA Reviews
- Mathematical Communication
- Information for Libraries
- Author Resources
- Advertise with MAA
- Meetings
- Competitions
- Programs
- Communities
- MAA Sections
- SIGMAA
- MAA Connect
- Students
- MAA Awards
- Awards Booklets
- Writing Awards
- Teaching Awards
- Service Awards
- Research Awards
- Lecture Awards
- Putnam Competition Individual and Team Winners
- D. E. Shaw Group AMC 8 Awards & Certificates
- Maryam Mirzakhani AMC 10 A Awards & Certificates
- Two Sigma AMC 10 B Awards & Certificates
- Jane Street AMC 12 A Awards & Certificates
- Akamai AMC 12 B Awards & Certificates
- High School Teachers
- News
You are here
Basketball Data Science

Publisher:
CRC Press
Publication Date:
2020
Number of Pages:
219
Format:
Hardcover
Price:
136.00
ISBN:
978-1138600812
Category:
Monograph
[Reviewed by , on ]
Russ Goodman
04/16/2023
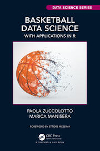
A relatively new entry into the sports analytics book market is Zuccolotto and Manisera’s Basketball Data Science: With Applications in R (BDS). BDS is a thorough introduction to learning and applying statistical and data analysis methods specifically in the sport of basketball. The authors showcase their BasketballAnalyzeR package and introduce the reader to its vast array of analysis and visualization tools. For those interested in any level of statistical data analysis in basketball, specifically in R, Basketball Data Science: With Applications in R would be a valuable addition to their library. Further, this text would be quite useful for a course in sports data focusing on basketball or for a student’s research project.
A look at the table of contents reveals a very sensible journey through data science analysis with ascending levels of complexity, from a useful acknowledgment of fundamental data science steps, to basic statistical analyses, searching for patterns in data, finding groups in data, and finally modeling relationships in data. The level of depth to the analysis techniques increases throughout the book eventually, honestly, beyond this reviewer’s level of statistical and machine learning comprehension. Do not take this as a complaint, as a reader with similar experience to this reviewer will end up with an enjoyable laundry list of statistical analysis concepts and techniques to learn.
The authors, all from the BODaI-Lab (Big & Open Data Innovation Laboratory) at the University of Brescia, effectively demonstrate their open-source BasketballAnalyzeR package. The package is a well-designed collection of tools for the analysis and visualization of basketball data and has two primary aims with the user in mind:
- Simplicity of use in minimizing the difficulty to the user in producing, most notably, outstanding visualizations that are based on the well-known ggplot2 philosophy of layered graphics.
- Flexibility of syntax where even the novice user can accomplish tasks quite readily, but where the more experienced user can utilize an array of options to perform more complex analyses or create additional layers on visualizations.
The book proceeds in earnest in the second chapter, discussing basic statistical and data analysis techniques, but also laying the foundation for the entire book’s work. All of the authors’ examples and sample analyses use the entire 2017-2018 NBA 82-game season’s data for all teams, which involves: teams’ box scores, opponents’ box scores, players’ box scores, play-by-play data, and additional qualitative data from the season. As a result, the authors indeed use old-ish data, but for the rest of the book, the reader is presented with an incredibly wide array of avenues of analysis of a season’s worth of data. The user need only put a different season’s worth of data into the appropriate form for use in the BasketballAnalyzeR package.
The list of sample analyses offered by the authors is too long and varied to include here, but here is an attempt at a brief summary of some (not all) ideas encountered, chapter-by-chapter:
- Data and Basic Statistical Analyses: studying pace with bar plots, using bar-line plots to visualize multiple defensive statistics, radial plots for comparing players, variability analysis on field goal percentages, inequality analyses with Lorenz curves and Gini coefficients, and shot charts with multiple variables
- Discovering Patterns in Data: statistical dependence of a team’s offense on their opponent teams, (pairwise linear) correlation among variables, analysis and visualization of a team’s network of assists, estimating event densities, and a variety of uses of machine learning and classification techniques
- Finding Groups in Data: k-means clustering of NBA teams or a team’s shots, visualized with radial plots and shot charts, hierarchical clustering to evaluate existing or to establish new player roles
- Modeling Relationships in Data: linear regression for modeling assists and turnovers per minute, nonparametric regression to estimate scoring probabilities and expected points scored, and geometric modeling of a team’s spacing with the convex hull of their offensive and defensive positioning
As one can see from the list above, BDS is a strong book with excellent, intriguing content. Quibbles include a small number of typos, a good number of moments where the author’s grammar or vocabulary might have been a bit lost in translation, but is still easily understood, and moments where they could have opted for more inclusive language, swapping out the consistent use of “he” for “they”. Relevant, eclectic quotes to start each chapter are a nice touch, with the reader hearing the voices of statistician David Moore, NBA player Marc Gasol, novelist Chuck Palahniuk, biologist Sydney Anderson, and British statistician George Box. The reader/user of this book would certainly have their statistical and data science perspectives broadened while also having their imagination sparked towards new and interesting basketball analyses.
Russ Goodman is a professor of mathematics and assistant women’s soccer coach at Central College in beautiful Pella, Iowa.
See the publisher's website.
- Log in to post comments


